_source_image_rec.tiff)
_source_image_rec.tiff)
_source_image_rec.tiff)
_source_image_rec.tiff)
_source_image_rec.tiff)
_source_image_re.tiff)
_source_image_r.tiff)
_source_image_r.tiff)
_source_image_.tiff)
_source_image_.tiff)
_source_image_.tiff)
_source_image.tiff)
Introduction
The chiropractic profession has long been interested in the use of radiography to analyze the spine. E. A. Thompson, D.C., Ph.C., professor of spinography at the Palmer School of Chiropractic, stated, "We introduced the X-ray into spine work back in 1910."1 Thompson noted that palpation is prone to error when evaluating vertebral positions and proposed the use of x-ray to improve the accuracy of this endeavor.1 Although plain film radiography is sometimes used to study spinal positioning or alignment2–5 there are inherent confounders.6–8 The image on the radiograph is subject to projection error. This projection error has been shown to affect both the shape and size of spinal segments in plain film radiography.7 This may pose a significant problem for those who seek to utilize radiographs to obtain measurements of bony position to be used as a part of the analytic process when rendering care to patients. For those who employ the Gonstead technique, this is a significant concern. The Gonstead technique employs a specific measurement procedure for the pelvis as a part of their analytic process.5 Weinert demonstrated conclusively that y-axis (axial) rotation of the pelvis on the anteroposterior (AP) radiograph does alter the Gonstead measurements of the pelvis.8 In the Weinert study, greater degrees of axial (y-axis) rotation tended to increase this measurement error. Therefore, in a clinical setting, it is important to understand the magnitude of any y-axis rotation that the pelvis may have undergone on the anteroposterior radiograph. To ascertain the magnitude of axial pelvic rotation on the anteroposterior radiograph, Coleman et al proposed a mathematical formula.9 They proposed that after using their method to determine the magnitude, if any, of pelvic y-axis rotation on the radiograph the findings of Weinert could be employed to give some idea as to the effect the rotation had caused on the Gonstead pelvic measurements in a particular patient. However, the mathematical method proposed by Coleman et al has not been tested by physical means.
It was quickly discovered that performing the needed computations by hand or calculator would be prohibitive in a clinical setting. Therefore, a computer application was developed by 1 of the authors (DAL) to allow the practical use of the formula. This application is available to the public at no charge at gonstead.com. The purpose of the present study is to determine how closely this computer method of determining y-axis pelvic rotation would match the measured physical rotation of 2 points which represented 2 points on a pelvis used to calculate the y-axis (axial) rotation of the pelvis.
Methods
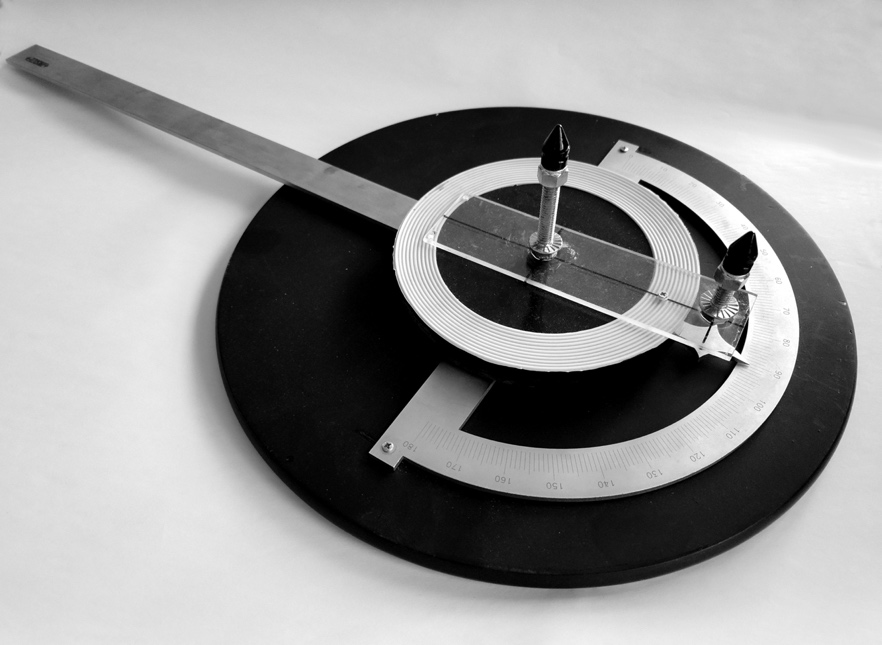
The study was conducted at Palmer College of Chiropractic in Davenport, Iowa. Previously a mathematical method designed to determine the rotation of a patient’s pelvis on the y-axis of the anteroposterior radiograph has been published.9 To study this further it was necessary to represent the 2 points used in this mathematical method of computation physically so that radiographs which showed these points could be made and actual measurements taken from those radiographs. To do this, a model was constructed by 1 of the authors (RJRH). This model included 2 metal points on the top of pins which were used to represent the 2 points on an actual pelvis which are needed in order to calculate rotation of the pelvis on the y-axis. These pins were attached to a metal protractor manufactured by Insize of Loganville, GA. The protractor measured 11.8 x 19.7 inches and was graduated in 1-degree increments. Built into the protractor was an arm that facilitated rotating a pointer, allowing a reading of the degree of rotation (fig 1). This protractor was advertised to be accurate to plus or minus 0.3 degrees. The horizontal distance between the 2 points on the tops of the pins was 100mm. The pins rotated when the arm was turned so that a measurement of the point’s rotation could be determined.

The pin, which was nearer to the x-ray source, was the taller pin and represented what was termed the mid-femur head point (MFH) in the article by Coleman.9 The MFH is the horizontal mid-point between the tops of the femur heads of a patient. The pin on the model nearer the image receptor, the shorter pin, represented the S2. The S2 point used refers to the point of “the junction of the patient’s right and left lamina to the sacrum at the second sacral tubercle” of a patient as viewed on the lateral radiograph.9 The mid-point of the second sacral segment at this level would be used on the AP radiograph. A measurement of the horizontal distance between these 2 points on the lateral and AP radiographs is a part of the processes needed to use the formula being studied which is proposed to allow for a determination of the degree of pelvic rotation, if any, seen on the AP radiograph. On the AP radiographs, a 3-member team worked together to determine the location of the points of the model on the radiographs. The location of the points was then used by a Diplomate of the American Chiropractic Board of Radiology (IDM) as points of measurements on the radiographs. The horizontal distance between these 2 points on the anteroposterior radiographs was measured using the X-ray systems digital measurement program.
Anteroposterior Radiographs
The model was placed in position for AP radiographs. Test radiographs were used to visually establish a 0-degree non-rotated position. AP radiographs were taken at 0 to 10 degrees of rotation in 2-degree increments at both the 40 (1016mm) and 72 (1828.8mm) inch source-image receptor distance (SID) and the distance from the point representing the S2 being 131.2mm from the image receptor.
Lateral Radiographs
In this study, images of the pins in the lateral position were unnecessary. Although a measurement of the horizontal distance between the MFH and the S2 on the lateral radiograph is necessary for actual patient care, when using this computer calculation, the distance between the 2 representative points on the model could be physically measured. This eliminated any error that might have been introduced in the process if the lateral radiographs had been used. This does not hamper the evaluation of the formula’s accuracy or application but rather enhances it. The horizontal distance between the model’s points was measured physically, allowing the most accurate assessment. Also, the accuracy of the portion of the formula dependent upon lateral radiograph utilization was determined by applying the formula for magnification and then compared to the results produced by the application.
Formula:
Where M is the amount of magnification, a is the source-to-object distance, and b is the object-to-image receptor distance.
Measurements were entered into the computer application to obtain the actual distance between the points measured on the model and then the results were checked manually using the above formula. This resulted in a more exacting test of this portion of the formula and computer application.
Examples
For the 40" (1016mm) SID the object-image receptor distance test distance of 10" (254mm) was used. Therefore using the formula for radiographic magnification the magnification factor was 1.33. The magnified horizontal distance that would be found on a lateral radiograph between the two metal points would then be 133mm i.e. 1.33x100mm, the measured distance between the 2 points. This is shown to be correct as 133mm divided by the magnification factor of 1.33 gives the result of 100mm, which is the correct measured horizontal distance between the two metal points on the model and these are the distances the computer application computed for both the magnified and true distances between the two points in the lateral view.
For the 72" (1828.8mm) SID the object-image receptor distance of 10" was used. Therefore using the formula for radiographic magnification the magnification factor was 1.16. The magnified horizontal distance that would be found on a lateral radiograph between the two metal points would then be 116mm i.e. 1.16x100mm measured distance between the two points. This is shown to be correct as 116mm divided by the magnification factor of 1.16 gives the result of 100mm, which is the correct measured horizontal distance between the 2 metal points on the model and these are the distances the computer application computed for both the magnified and true distances between the two points in the lateral view.
AP Radiographs
The AP radiographs of the model were obtained by using a certified X-ray technician (JLB) who operated the X-ray machine, and (RJRH) who rotated the metal model. JLB ensured that the SID was correct and without tube or bucky tilt. The axis of rotation (pivot point) around which the model rotated was the taller pin, representing the MFH, which was nearer to the x-ray source. The distance of this pin from the image receptor was 231.2mm (8 inches from the bucky and 28mm from the bucky front to the image receptor). The horizontal distance between the 2 pins on the model was 100mm, resulting in the pin nearer the image receptor being 131.2mm from the image receptor. The radiographs were obtained at the 40-inch (1016mm) and 72-inch (1828.8mm) SIDs with the model in rotations of 0 to 10 degrees of y-axis rotation in 2-degree increments.
The resulting digital radiographic images were analyzed. The analysis was performed utilizing the AMBRA program manufactured by Ambra Health, 450 Park Avenue S.10-111, New York, New York, USA. The operation of the program was done by a Diplomate of the American Chiropractic Board of Radiology (IDM), who used the analytic program to obtain the horizontal distance between the tops of the 2 metal points of the model, as seen in figures 2-13. The process involved placing a dot at the top of each metal point by (IDM) and erecting a vertical line above that point. The analytic program was used to measure the horizontal distance between these two lines. The correct placement of the model tip points was confirmed to be correct by 3 members of the Palmer College of Chiropractic faculty (RJRH, RAH, MJT). The distance between these 2 points on the AP radiograph represents the MFH to S2 offset used in the Coleman et al article.9
_source_image_rec.tiff)
_source_image_rec.tiff)
_source_image_rec.tiff)
_source_image_rec.tiff)
_source_image_rec.tiff)
_source_image_re.tiff)
_source_image_r.tiff)
_source_image_r.tiff)
_source_image_.tiff)
_source_image_.tiff)
_source_image_.tiff)
_source_image.tiff)
Computer Application
Using the article by Coleman et al,9 an open-source, cross-platform application was developed using Java, runnable on any device that can install the Java Runtime Environment, including Windows, Mac, and Linux computers. This application was developed using the Open Java Development Kit, or OpenJDK, developed by Oracle Corporation and licensed under the GNU General Public License, or GPL, version 2. It utilizes the standard Java library for computation of mathematics, along with the JavaFX library to create a graphical user interface using the JavaFX scene builder. The code is hosted publicly on Microsoft’s GitHub code repository service and is licensed under the GNU GPL version 3.
Formulas from the article were used to develop an algorithm to take input measurements and automatically compute result values. The algorithm was implemented using Java code and tested using real world data and manually calculated results. The graphical user interface was then designed and implemented to allow users to easily run the algorithm, view and save results, and open previously saved results. The finished program’s source code was then packaged as a runnable JAR file and uploaded to GitHub as a release. Included in the release is a README.md file that has installation and usage instructions.
Entered Values
The following values were entered into the computer application:
-
SID
-
The distance between the point representing the S2 to the image receptor when the model is in the position to represent the patient positioned for the lateral radiograph. In this study, this was 10 inches for both the 40-inch (1016mm) and 72-inch (1828.8mm) source-image receptor distance.
-
The horizontal distance on the lateral radiograph between the 2 points when the model is in the position to represent the patient positioned for the lateral radiograph. In this study this was 133mm for the 40-inch (1016mm) SID and 116mm for the 72-inch (1828.8mm) SID.
-
The distance of the pin representing the S2 to the image receptor when the model was in the position for the anteroposterior radiograph. In this study this was 131.2mm for both the 40-inch (1016mm) and 72-inch (1828.8mm) source-image receptor distance.
-
The horizontal offset, the horizontal distance between the 2 pins found on the anteroposterior radiographs.
Results
The degrees of rotation of the model, the degrees of rotation calculated by the computer and the difference between the 2 for both the 40" (1016mm) and 72" (1828.8mm) SID are shown in Table 1.
The horizontal offset between the 2 pins on the anteroposterior radiograph at the 40" (1016mm) SID was 1.19mm, 5.87mm, 9.16mm, 13.20mm, 17.73mm and 21.30mm for rotations of the model of 0,2,4,6,8 and 10 degrees respectively. Radiographs of rotations of 0,2,4,6,8 and 10 degrees are shown in Figures 2-7.
The horizontal offset between the 2 pins on the anteroposterior radiograph at the 72" (1828.8mm) SID was 0.35mm, 3.67mm, 7.61mm, 11.59mm, 15.98mm and 19.42mm for rotations of the model of 0,2,4,6,8 and 10 degrees respectively. Radiographs of rotations of 0,2,4,6.8 and 10 degrees are shown in Figures 8-13.
The SID, the horizontal offset between the 2 pins obtained from the anteroposterior radiographs, the horizontal distance between the two metal pins that would have been present on a lateral radiograph, and the placement of the model in relation to the image receptor in both the AP and lateral views were used to make the computations made by the computer. In our model the taller pin, which was the pin farther from the image receptor, was the axis of rotation around which the model was rotated and which represented the MFH. Therefore, the computer application computed the degree of rotation of the model using the MFH as the axis of rotation.
Rotations
The model was rotated 0 to 10 degrees in 2-degree increments. The degrees of rotation of the model were compared to the degrees of rotation which the computer calculated. At each point of rotation the difference between the rotation of the model and the computer calculation of that rotation was less than 1 degree, as shown in Table 1.
Discussion
It might be thought as the measurements for the 40" (1016mm) SID were started from the position of the model in the 0-degree position with 0.6 degrees of -y-axis rotation then 0.6 should be subtracted from all the rotations as all rotations are also in the negative -y axis direction. If this were done it would give us a difference of 0.3, 0, 0, 0.3 and 0.1 degrees between the measured mechanical rotation and the calculated rotation for 2,4,6,8 and 10 degrees of model rotation respectively.
We do not wish to do this. It is true that the approximate magnitude of rotation difference seen in the 0-degree image appeared to be carried through in the 2,4,6,8 and 10 degree rotations. It is logical to assume that the difference may largely be a result of the error created when the 0-degree position was being sought, especially because the offset can be seen on the 0-degree position of mechanical rotation in figure 2. However, in this case, the amounts of difference at all rotation points are so small, and as they do vary from the 0.6 degree 0-point measurement, some of the difference occurred due to other factors such as minor errors in rotating the model through the various degrees of motion complicated by the up to 0.3 degrees of inaccuracy that the manufacturer states is in the protractor device used to turn the model or for other reasons. If the error at 0 degrees of rotation had been larger we would feel that considering that in the calculation, especially if it seemed to affect the other rotation degrees as it does in this case, might very well be appropriate. However, we have not done so in this case even though it affects the difference in measurements between the physically turned model and the calculated outcome.
The same things could also be said regarding the off centering at the 0-degree point at the 72" (1828.8mm) position although the off centering at the 0-degree position is less and results in a 0.2 degree difference in rotation which would give differences of 0.3, 0.2, 0.1, 0.3, and 0.2 degrees for 2, 4, 6, 8 and 10 degrees of mechanical rotation respectively.
Fortunately, there is no need to compare the calculated rotation to a physical measured amount of rotation for accuracy in the clinical setting. It was necessary to do so to test the outcomes of the computer application compared to a physical method of rotation; however, in actual practice the computer application is calculating only the rotation found on the radiograph. The added errors that may be produced by the process needed to compare the measured rotation of the model to the calculated rotation are absent. The physical rotation of the physical model is subject to error. However, that error would be removed in actual clinical practice. Although it should be noted that other potential points of error such as more difficulty in point selection for the MFH and S2 points on an actual pelvis might come into play.
This study sought to compare the difference between a measured mechanical method used to rotate a model and the mathematical method proposed by Coleman et al9 to quantify pelvic rotation on the AP radiograph and also checked the computer application’s accuracy. In this study, the computer application was able to determine the rotation of the model to an accuracy of 0.9 degrees or less at all measured degrees of rotation at both the 40-inch (1016mm) and 72-inch (1828.8mm) SID. Beside the ability of our computer method to calculate the degrees of rotation accurately, we had other concerns regarding the model rotation. There were 3 points of particular concern as we progressed through this study. First was the accuracy of the protractor. This was advertised to be plus or minus 0.3 degrees. Second, was the operator’s ability to turn the model to the exact degree of rotation, and third was the accuracy of the x-ray program used to analyze the radiographs. All of these and others would be potential points of error. While all 3 may have affected accuracy, we suspect that the ability to turn the model exactly and the accuracy of the protractor could be the most significant sources of error in this study. However, given the fact that Owens10 concluded that, “Reliability studies exist showing that inter- and intra-examiner reliability are sufficient to measure lateral and rotational displacements of C1 to within ±1 degree or better.” and as our results are within that range we feel we are at the limits of our measurement abilities. We suspect that those who are familiar with this field may have concerns about how translation on the x-axis or alignment of the x-ray tube relative to the image receptor may have affected this study.
It is well known that x-axis translation results in projected y-axis rotation.7 Therefore if the tube is misaligned such that it created an off centering on the x-axis it would have affected the projected rotation of the model.11 Additionally, the misalignment of the model on the x-axis relative to the central ray is a concern. However, in the present case, we are measuring the projected image of the model on the radiograph. This radiograph includes the effects of any x-axis translation and any tube misalignment in the image. Both of these factors, if present, contribute to the projected image. It is unnecessary to account for the amount that each may contribute to the projected rotation. Our need is to quantify the degree of rotation of the projected image and that is what this study does. So, while improving tube alignment and reducing x-axis translation are desirable endeavors, our methods work with the resulting image regardless of the cause of the projected rotation.
For those practitioners using the Gonstead method of radiographic pelvic analysis, y-axis rotation of the pelvis has been shown by Weinert8 to be a confounder when seeking to obtain pelvic measurements. This study shows that a mathematical method can be used to calculate the rotation of the 2 points needed by this computer analysis method to an accuracy of less than one degree on the AP radiograph when compared to the rotation of a model. If the distance between the 2 points represented by the model, the MFH and S2, were located on the pelvis of a patient that distance could be used to calculate the rotation of the pelvis on the AP radiograph in a clinical setting and determine if the confounding noted by Weinert, a changing of the pelvic measurements, had occurred. Weinert8 noted how much the Gonstead listings changed with each degree of y-axis pelvic rotation as seen on the anteroposterior radiograph. The information provided by the Weinert article coupled with the results of the present study may allow the clinician greater insight into how much the pelvic measurements may have changed in a particular patient. This might allow the clinician to have more accurate information regarding their patient.
A 2025 article explores the factors affecting femur height measurements on the AP radiograph when axial pelvic rotation is present.12 Although it is beyond the scope of this article to discuss this confounder, it should be noted that determining the degree of the projected y-axis rotation of the pelvis alone on the AP radiograph may not be sufficient to allow an accurate measurement of the difference between the projected femur head levels. Projected y-axis pelvic rotation on the AP radiograph is a result of a combination of both y-axis rotation and x-axis translation.7 While true y-axis pelvic rotation can affect femur head levels on the anteroposterior radiograph, x-axis translation of the pelvis does not do this even though it can contribute to the projected y-axis rotation. Therefore if the clinician seeks to determine femur head levels on the AP radiograph when the radiograph shows projected y-axis rotation they must determine how much x-axis translation has contributed to the projected y-axis rotation and how much the projected error is a result of actual y-axis pelvic rotation. The methods discussed in this article are designed to determine projected y-axis rotation on the AP radiograph but they cannot differentiate between projected rotation that is caused by true y-axis pelvic rotation and any projected rotation that was caused by pelvic x-axis translation. However, there may be a practical fix. If the clinician would locate the center of the point on the bucky that corresponds to the center of the radiograph and then ascertain that the second sacral tubercle area of the patient is centered on that area it would greatly reduce translation on the radiograph of the second sacral tubercle and if centered correctly any offset between the mid-femur head point and the second sacral tubercle on the radiograph would be as a result of rotation on the y-axis of the mid femur head point relative to the second sacral tubercle. The proper patient placement could then be confirmed by viewing the position of the second sacral tubercle on the radiograph. Without a suitable understanding of this phenomena errors in femur height level measurements can occur.
Models can be used to aid in simplifying the study of a problem. That was done in this case. The authors are experienced in radiographic measurement and were surprised that the difference in the measurements between the measured model’s rotation and the calculations were not more remarkable.
While we have noted its relevance to the Gonstead method, this work has much greater relevance than just one technique or even the chiropractic profession as a whole. This method is a tool. The concepts presented here will hopefully allow the reader to more accurately understand projection error on the AP radiograph. The user can use this tool for different reasons. One reason is to rule out projection distortion due to y-axis rotation on the pelvic radiograph. However, a greater clinical benefit might be to help understand that projection error is occurring, and by understanding this method, improve x-ray machine alignment and patient placement, thereby making this tool unnecessary. Perhaps this tool will encourage the good x-ray practices that all should use.
Scoliosis is of interest to both the medical and chiropractic communities. Measurement of the scoliosis is often done on the anteroposterior radiograph.13–15 If the pelvis is rotated on the y-axis this could introduce projection distortion into this endeavor due to the rotation introduced into the spine.
Another question that might arise is if this method can determine the difference between rotation error or structural asymmetry of the pelvis. While this is not a method designed to determine the difference between rotation error and structural variation one cannot utilize the AP radiograph to attempt to evaluate structural asymmetry of the pelvis without determining that the rotation and the projection distortion produced by this rotation is not present. Y-axis rotation will produce projection error that can confound such attempts. Included in this projection error would be a greater magnification of one side of the pelvis compared to the other.
This tool is not intended to determine when or when not to obtain radiographs nor should it be used to justify repeat radiographs. But it is intended to aid the prudent clinician in better understanding radiography projection in a practical manner. We also feel that as AI becomes progressively more common and powerful this tool may assist in providing an origin, i.e. 0 point, to aid in engineering analysis of the spine. Engineering analysis of the spine may be the future of spinal care resulting in thoughts and treatment processes not thought of today. Accurate measurement would be necessary to this process. Accuracy in measurement is important and this is a move in that direction. But it should be looked at as a beginning. It is noteworthy that some in the chiropractic profession feel that spinal alignment is of great importance while others feel it has little importance. Although we wish to avoid being dragged into that discussion, accurate measurement should be of interest to both sides of this issue. But this is merely the start of this type of investigation. Models are used when we wish to simplify a problem so that it may be better studied. While it works better than we expected in this model and this greatly increases our confidence, a 2-point model is not a bony pelvis and that would be a logical next step and a step that will almost certainly bring out different problems. We also wish to point out that it appears to us that this same process, with small modification, can be used to see if lateral radiographs are truly lateral or partially rotated into another plane. There is much to be explored and we hope that other researchers will join us in this exploration.
Limitations
This article uses a model to represent the 2 points on an actual pelvis needed to determine pelvic rotation. This type of model allows the studying of a more complex object but cannot wholly represent an actual patient. Only 1 model and 1 point of placement of the model in the x-ray beam relative to the image receptor were used. While the protractor was advertised to be accurate to 0.3 degrees, we have no way of confirming that. However, we believe it to be quite accurate as the measured rotations of the model matched the mathematically calculated degree of rotation at each point of measurement to a difference of less than 1 degree. This type of accuracy would be very unlikely if either the protractor or the computer application were not both quite accurate. The use of this model simplifies the location of the points needed to make the calculations. This will most likely be significantly more complex when working with radiographs of actual patients in a clinical setting. This is a step in the process of better understanding this type of radiographic confounding. A next step might involve the use of phantoms and we have already begun working on that study.
Conclusion
The computer calculated degree of y-axis rotation of the metal model at the 40-inch (1016mm) SID was 0.6, 2.9, 4.6, 6.6, 8.9 and 10.7 degrees of y axis rotation at 0, 2, 4, 6, 8 and 10 degrees respectively of the metal model’s measured mechanical axial (y-axis) rotation.
The computer calculated degree of y-axis rotation of the model at the 72-inch (1828.8mm) SID distance was 0.2, 1.9, 4.0, 6.1, 8.5 and 10.4 degrees of y-axis rotation at 0, 2, 4, 6, 8 and 10 degrees respectively of measured mechanical y-axis rotation of the model. This method of calculation can determine the rotation of a model designed to show two points necessary for the calculation of y-axis pelvic rotation on the anteroposterior radiograph when compared to the measured physical rotation of the model to an accuracy of less than 1 degree.
Acknowledgement
We would like to thank Ian D. McClean, D.C., D.A.C.B.R., Director of Clinic Radiology, Palmer College of Chiropractic for his radiographic analyzation.
Funding
Funding provided by the Gonstead Clinical Studies Society, Santa Cruz, CA.
Facilities and equipment provided by the Palmer College of Chiropractic, Davenport, IA.