
INTRODUCTION
The clinical measure heart rate variability (HRV) may have value within the practice of chiropractic. A rationale was presented in 1999 by Eingorn and Muhs1 who reported that ‘heart rate variability is in widespread use in the fields of neurology, cardiology, psychology, psychophysiology, obstetrics, anaesthesiology, and psychiatry.’ The first reports of its use in chiropractic were a case report in 20001 then conference presentations in 2004.2–4 Formal investigation followed with 1 finding that ‘High-velocity and low-amplitude manipulation of the thoracic spine appears to be able to influence autonomic output to the heart in ways that are not duplicated by a sham procedure or by other forms of somatic/physical therapies.’5 Recently Hart reported a case in which he identified what he considered to be the optimal level of HRV needed for spinal adjustment.6
A relationship between chiropractic treatment and HRV is strongly suggested; however, there seems to be no consistent protocol for either the instrument that is used or the data to which meaning is added. For example, Hart reports his data as ‘root mean square of the successive differences between heart beats (rMSSD)’6 while others7 use the ‘standard deviation of a sequence of beat-to-beat measures of heart rate where peak beat is ‘N’, thus SDNN.’
The opportunity for clinicians to use HRV in practice increased in 20188 when the company Apple launched the ‘i’ operating system number 11 (iOS11) which in turn triggered my own inquiries into the matter. The functionality is tied to the operating system (OS) of that company’s watch, a consumer wearable (CW) which is usually paired to an Apple phone. Technically, the phone has 1 OS and the watch another and their version numbers are not aligned, but in this paper I will consider them as a single operating system. When HRV is obtained by a CW, I term it a ‘convenience HRV’ or cHRV.9
Another company is using the camera on the smart phone itself in what it calls ‘smartphone photoplethysmography (PPG)’ with which it determines values for HRV. Plews et al showed the validity of this approach.10,11 They used rMSSD compared with ECG. The company promotes its product as a valid tool to guide the training of elite sportspeople.12 My only caution here is to appreciate their data is not representative of the patients most seen by conventional chiropractors. They do make the general point to ‘always interpret your HRV data with respect to your historical data … no point comparing your HRV to another person … normal might be different from [another] … and that means nothing.’13 They add that the different normal baselines are ‘most likely due to genetics and other factors hardly modifiable’.
This paper is a report of my findings using my own CW to observe what it provides in terms of monitoring my own HRV. My report is a pragmatic descriptive narrative and carries no inferential status. My findings are ‘time and place’ descriptions, which inform my narrative and the recommendations that arise from my experiences. I make no comment about the accepted approaches to measuring HRV with known instruments however my findings allow a recommendation regarding the value of instantaneous measures of HRV whether from traditional instruments or a CW. Information regarding the devices used in this report is given in my declaration. I also give a caveat for this report.
Heart rate variability
The measurement of HRV is an established clinical procedure14 with external sensors attached to the body as either a cuff around an arm or more commonly as a chest strap.15 The data take a number of forms where visualizations of heart rate are typically the QRS wave where the peak beat is the apex of the R-wave. The SDNN value is the measurement of standard deviation in time as milliseconds (ms) between peak beats.
In basic terms, HRV documents the non-constant time periods between heart beats in a given period. It is accepted as an indicator of the communication of the autonomic nervous system (ANS) with the heart. The ANS is continually ‘advising’ the heart of changing demands in real time and the heart usually responds as directed. HRV is not a steady value due to the constant flow of informed instructions that create variability in heart rate. The counter-intuitive theory is that a greater variability shown as a higher value of HRV reflects a more responsive ANS, which is deemed preferable. It is known that low values reflect reduced vagal control of cardiac rhythm.16
In clinical terms, HRV allows comparison of a measured value with a chart of found values from statistically relevant cohorts given by gender and age.17 The meaning of HRV in the clinical setting seems yet to be settled.18,19 The most prolific reports are by commercial bodies who build their business model on selling a relationship with fitness to users enabled to monitor their own data.20–22 One such company claims it is ‘scientifically validated’13,23 and the usefulness of their data is that they are derived from large cohorts of healthy users.
Principles of Instrumentation
The glossary in Table 1 has reference for this section. I am not overly concerned with matters of accuracy or precision, as CWs are reported to be have been developed and tested to achieve an acceptable level of accuracy. However, we do not know the degree of variance (VAR) that is acceptable in cHRV values. The same applies to the similar term ‘granularity,’ a visualized measure of the closeness of multiple readings about the actual reading. In other words, would a 5ms difference between 2 successive readings have meaning? Or are several readings about a common time tightly granular being all within a 3ms range for example, or loosely granular, within a 10ms range. This is a relevant matter to consider and the technical term is the ‘level of measurement error’, first in the laboratory where all conditions can be controlled, and then in the applied clinical environment where there is commensurately less control.

My report ignores the laboratory environment and concentrates on pragmatic application in a real-world environment, the manner in which chiropractors would typically use the instrument. In a sense it is acceptable for cHRV to be reliably imprecise, meaning that if there is a relatively small bias away from a perceived accurate value then it is of little consequence when the bias is constant and the same instrument/patient combination is used.
I have addressed the questions around measurement error elsewhere24–26 for a different instrument and the principles remain the same. Clinicians need a level of confidence that (a) the CW will reliably return a ‘close enough’ value of cHRV that can be taken as the HRV value at a particular time, and (b) that at any particular time during a day the cHRV will be similarly ‘close enough.’ If 1 or both of these conditions are not met then the CW would not meet any test of reliability and therefore have no clinical role at this time. My inquiry focussed on answering these 2 questions within the broader null context that the CW would not do either. Further, the ability of the CW to return data at the time of the clinician’s choosing would be important.
Relevant Statistics
I plotted paired data being ‘days of the week’ as a 24-hour period for 7 consecutive days on the x-axis, and the returned value of cHRV in ms on the y-axis. The trend line for a week is a slope of best-fit connecting the average for each day and is calculated as a function within the spreadsheet. Technically, it is the slope of the least squares line of best fit and to apply meaning the software assigns a value known as the correlation coefficient represented as r. The software returned the r-value as R2 or Linear Regression analysis,27 which produces a line called the ‘slope of the best-fit’ for the collection of data shown as the mean values for a period. In this report the mean values are the simple arithmetic average of all readings in one 24-hour period from 0000-2359, representing 1 day, with the collection being for 7 consecutive days constituting one week. The slope or trend-line thus represents the shift during one week of the average of daily readings.
The factor which renders a CW of little value in the clinical environment is the inability to determine when the reading is to be taken. Apple’s CW logs the time the reading was taken and there seems there is no logic or predictable sequence for when these occur throughout the day. Further, the frequency of readings during 1 day is variable, ranging from 1 to several. To manage this lack of user control and its attendant variability the data points were set to fall within periods as 0000-0500, 0501-1200, 1201-1700, and 1701-2359. Analysis allowed for more than 1 reading per period, a random characteristic of the device.
In clinical terms it would seem preferable for the trend line to be about 0, or without slope which would indicate ANS stability over a week, dependent on all other variables being controlled. The pragmatic view is that it is not possible to control real-life variables meaning a slope is to be expected. While an R2 value around 0 indicates a more stable ANS over time ranging between -1 and +1, the overall height of the slope indicates reactivity or responsiveness, the higher the greater reactivity, within reason.
Slope values close to 0 imply that there is little to no change in the relationship28–30 which means the value of HRV does not change much over time. In the pragmatic sense the clinical value is the trend over time, and a down-slope indicates decreasing values of the mean by day, and up-slope shows it it increasing over the sampling period. As the value of r moves towards +1, we interpret a positive linear relationship which means that as time passes then the value of HRV increases.
Inquiry
I use the form of a descriptive narrative to report my pragmatic inquiry into the potential for CWs to become a useful instrument in the practice of chiropractic. My conclusion will respond to my Experienceable Different Test that, at the time of preparing this report ‘CWs do not offer sufficient reproducibility to warrant inclusion by a chiropractor as an instrument in clinical practice’. This test shall hold should I not find evidence to the contrary, and if I do find acceptable evidence then I shall conclude that CWs may be worth considering for use in assisting the clinical evaluation of an individual’s health status. A new problem will then be to find the meaning of cHRV gathered by CWs.
METHODS
I have been recording my own HRV on almost a daily basis from 1 May 2019. From that time, I believed the data was collected during my use of the Breathe™ (Apple) app and I included a breathing exercise in my morning routine health check. This app is a simple program that provides a tactic metronome to guide respiration over a set period, allowing the user to set the desired number of respirations over the desired time. My settings were of 4 breaths, resting, per minute. The outcome is that for an 18 month period my HRV data were recorded under relatively stable conditions of sitting in the same chair with a constant ambient temperature about the same hour of each day. In retrospect it became obvious that the CW recorded HRV values at other times during any day and not consistently during the time the Breathe app was used.
Therefore to gather the data I subdivided the 24h day into periods suggested by the times the CW had randomly recorded its readings. These convenience periods were 0000 to 0500, 0501 to 0700, 0701 to 1200, 1201 to 1700, and 1701 to 2359. The charts were populated with historical data held in the phone paired with my watch. Each day the watch automatically documented several readings with the time each was taken, rounded to the minute. At the time of the analysis these readings were matched into one of the convenience periods in a Numbers™ spreadsheet. At times there were 2 readings per period, but mostly only 1; all were entered.
The data were accessed retrospectively. A day on which I received upper cervical Gonstead adjustment was chosen to be the last day of a 7-day period I termed week 0. The 3 weeks prior to that, counting backwards were week -1, week -2, and week -3. The three weeks after that day of adjustment became weeks +1, +2 and +3. All data for week 0 were excluded to remove the possibility of any ‘anticipation effect’ and, of course, any effect on the day of adjustment. It turns out that no data were taken by the CW on the day following the time of spinal correction; thus, the readings on the first day of Week +1 represent the first post-correction data.
The 6 weeks for which data are analyzed were each uneventful in terms of life events that couldimpact HRV31 and were within a period of pandemic lockdown where I was limited to travelling no further than 5km (3.11mi) from my home, with an 8:00pm curfew. My attendance for chiropractic care was a permitted activity; however, I was required to carry details of the appointment as evidence of my reason for being beyond the 5km home radius.
One day was selected in each week to find evidence of diurnal variation. The circadian characteristics of HRV are established32 but not ultradian.33 At night, there is a protective effect of the parasympathetic nervous system, whereas in the morning the sympathetic nervous system activity peaks.21–23 The clinical interest for chiropractors is the extent to which these variations persist during a daytime period when it is more likely for chiropractic care to be provided. The importance of these data is to provide an estimate of the known changes to autonomic tone that occur during a day,34 a factor that must be considered when planning to use cHRV as a clinical indicator.
My diet was consistent during the period of data collection. The role of nutrition, in particular large fatty meals, has been reported to exhibit a circadian variation with significant changes in HRV in the second quarter of the day.35
Note that I do not give the actual values that were recorded, as I regard them to be identified personal information; however, all representations of that data are fair and accurate representations of real data recorded by my watch and held in my phone. On the basis that I have made an informed decision to report my own data with no specific values there is no requirement for third-party ethics consideration.
RESULTS
The Matter of Week-to-Week Means
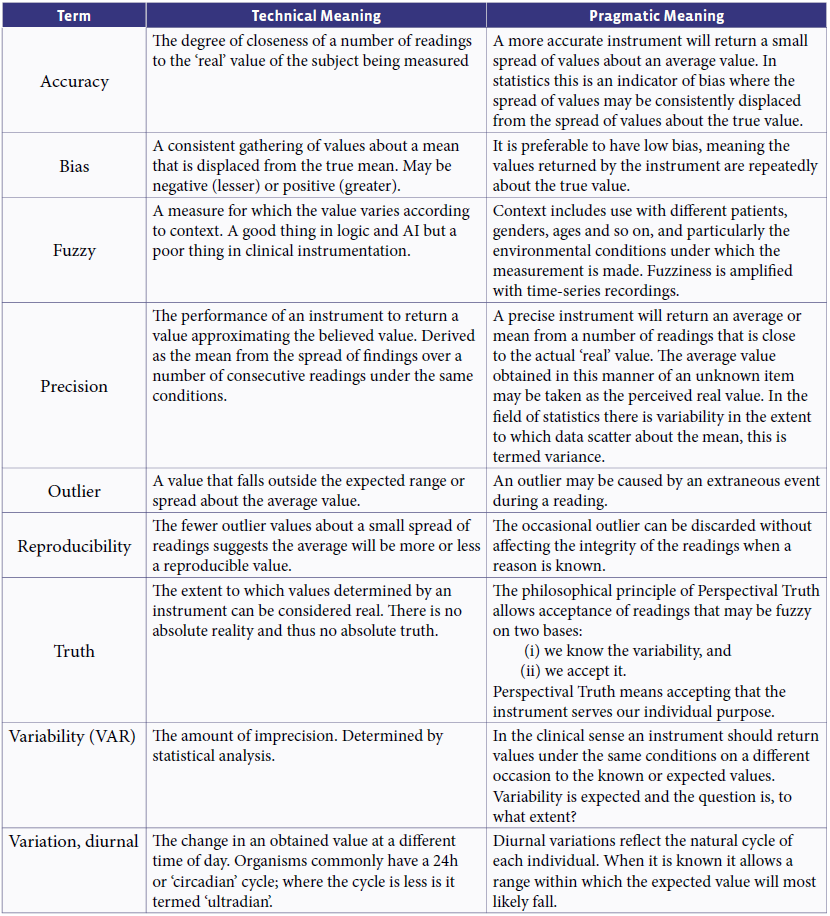
Figure 1 shows the values of the weekly means with standard deviation bars for all 6 readings. The first 3 plots are the mean of the daily means for each of the 3 weeks prior to chiropractic correction, and the 3 plots to the right represent the mean of the daily means for each of the 3 weeks after chiropractic correction.
The mean of the means for the 3 weeks prior and 3 weeks post showed significant difference at p = 0.12 (2 tailed, paired, alpha = 0.05, 95% confidence). The data of interest not shown here are the values for Variance, being 6.25 for the 3 weeks pre, and 0.17 for those post. This suggests the post-correction data are more tightly grouped (STDEV 0.4) than those prior to correction (STDEV 2.5).

A trend across all weeks was determined from the line of best fit (dotted line) for the mean of each of 7 days but whether or not the trend has meaning when viewed over a longer period of several weeks, as reported by Haas and Russell,7 is still unresolved in my mind. The confounding finding is that the mean is sensitive to the variance within a day compounded by taking 7 consecutive days where the highest recorded value was greater by a factor of 10 than the lowest. The variance is great and seems difficult to control and as long as great variance exists the readings will be unreliable.
The pragmatic visual impression of Figure 1 is the difference seen in the post correction data in that the mean values decreased, meaning the mean value of weekly readings over 3 weeks was lower. The clinical question is whether or not this reflects enhanced wellbeing. By contrast, Haas and Russell7 associated an upward trend with positive outcomes, as did Hart, saying ‘higher is better.’6
I think the real difference could be not so much the actual value but more the standard deviation (STDEV) which reflects variance (VAR) or scatter among readings as means over time periods The principle is that the higher the STDEV the less accurate the data, and in turn, high VAR indicates that ‘numbers in the set are far from the mean and from each other, while a small variance indicates the opposite.’36,37 For this report, the values of VAR are taken from automated functions within the spreadsheet and that my data sets are not appropriate for ANOVA testing.
The question thus becomes, what is the optimal clinical state of the ANS? Is it better to be reactive and showing a high variance, or stable, showing a low variance? I also note that I am not making any claim that there is an association between spinal correction and cHRV, even though these data show a drop in the mean values taken over 3 weeks post correction. This may be an artefact confounded by within-day VAR.
The Matter of Variance within One Day
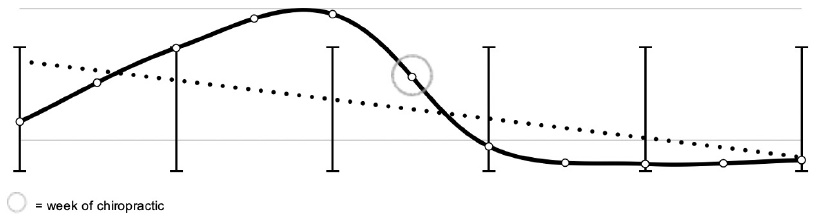
Figure 2 shows the values for one selected day from the 3-week period before and another from the 3 week period after chiropractic correction. I examined the data for one 24h-day in the second of the 3 weeks before chiropractic correction and again for one 24h-day in the second of the 3 weeks after and chose a day in each of those weeks that had readings for each period.
_and_one_day_post_(solid_curve)_chiropractic.png)
The dashed curve represents pre and the solid curve, post. Both show a hump and the pre-day shows 2. These only mean that the variance is high, being 164 for the 1-day pre-, and 129 for the 1-day post-. Each is about 7 or 8 times greater than the mean for that day. While each day has a similar shape the magnitudes differ. The means are not significantly different at p = 0.385 (t-test, alpha p = 0.05, 95% confidence). This finding alone suggests there is no real difference pre- and post- correction; however, the presence of high values of variance speak to 1 very important matter.
The size of the variance shows that the cHRV recorded by a CW differs greatly during the day, in both the pre- and post- conditions. For the purposes of clinical assessment it is the value recorded before correction that matters as it is the value most likely to be found in a patient presenting for care (dashed curve). For the purposes of seeking some idea of cause and effect, the relevant measure is the value recorded after correction (solid curve). The negative slope of the trend line for the day prior to care seems to show that HRV is more volatile than is shown by the level trend post-care.
I suggest the value of 1-day of data may be to indicate a less labile heart rate, but my opinion remains that 1 reading on 1 day has no value in the clinical context. To use only a 1-time value of cHRV to compare pre- and post- cardiac activity is fraught with error and should not be accepted as a measure with any validity. To take a measurement is to take random sample from highly variable data.
The knowledge we take from Figure 2 is that individual one-off measures of cHRV with a CW and for that matter probably also of HRV with conventional means, have little clinical value. In pragmatic terms the values fluctuate wildly over a normal day and that it does not seem possible to randomly find a value that holds a meaningful relationship to another randomly selected value some time later.
Clinically this may suggest the use of the trend line as the comparator for recorded data between occasions. The data that have the greatest potential to inform the clinician are longitudinal data and I demonstrate that with Figure 3.
_before_(solid)_and_1_week_(_2)_after_(da.png)
The Matter of the Mean from Week to Week
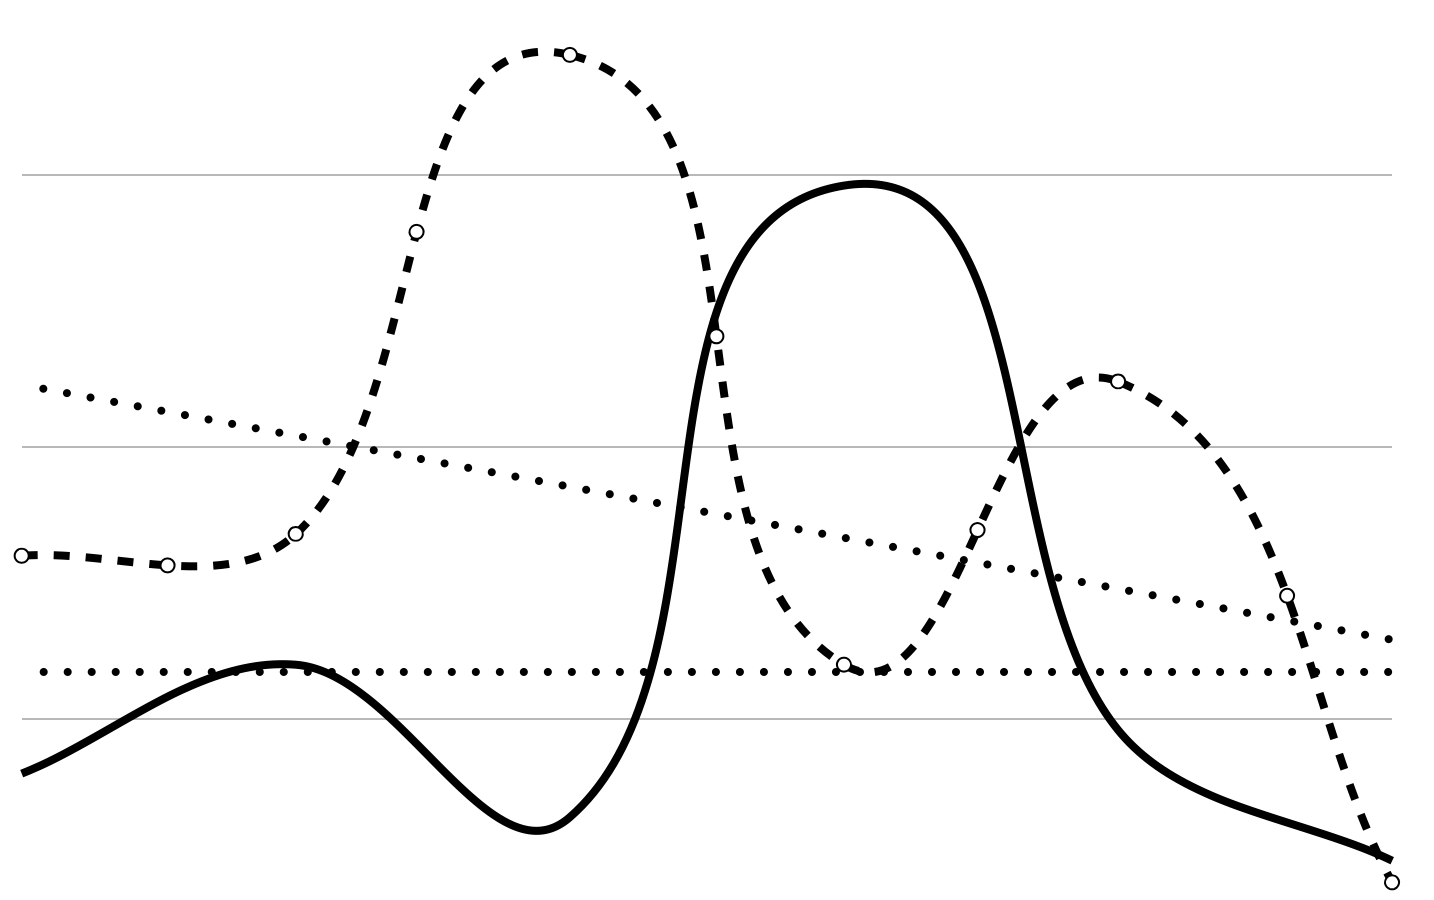
Figure 3 charts the data for week -2 (dashed curve) and week +2 (solid curve). The charts for the other two pairs of weeks (-3, +3; -1, +1) are very similar as to be expected from the data given in Table 2. I do not show the trend lines as I see no meaning in them, rather I show the mean cHRV for each week, the upper dotted line is ‘pre’ as week -2, and the lower, ‘post’ as week +2. These show there is no statistical significance (p = 0.12) between the different means pre and post. The value is small, at 5.3ms, suggesting that value lies in using mean data at all times and not instantaneous data, and that a week of 7 consecutive days may in some cases allow valid statistical meaning. The wild undulations are warning signs to those who seek inference from any one or two instantaneous or ‘spot’ readings and certainly show caution is needed with cHRV from CWs.
_and_post_(_)_correction.png)
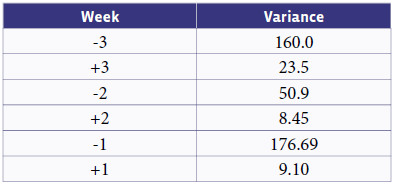
These data provide a clear illustration of the irrelevance of instantaneous measures and point to the need to obtain mean values over a period of time. The variance shown in Table 2 represents the spread of the daily mean values in one week. The negative numbered weeks are pre chiropractic correction and the positive weeks are post.
The greatest variance is seen in week -1, the week before the week of correction. The variance in week +1, the week immediately following correction, is 9.10. The difference in means between these two weeks is not significant at p = 0.23 (alpha 5% at p = 0.05, 95% confidence).
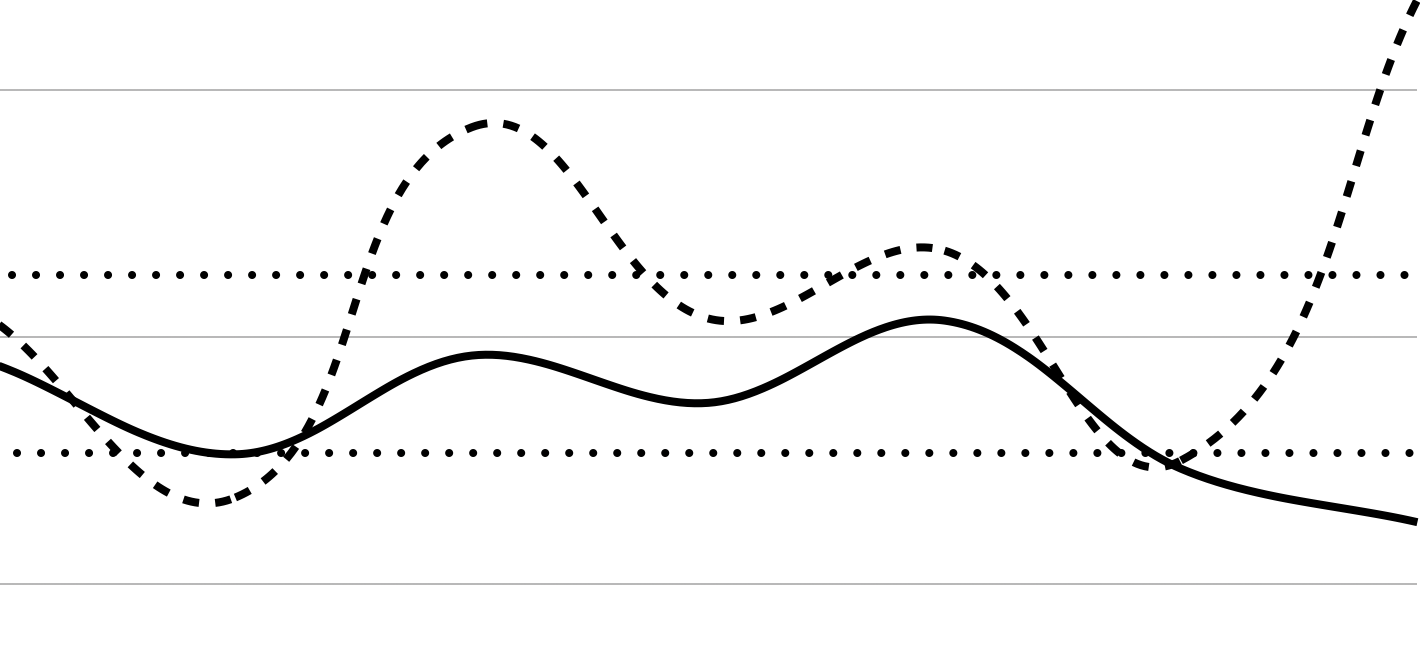
Figure 4 shows the divergence of the trends For week -2 and week +2. The grey reproduces the data shown in Figure 3, and the dashed line is the trend 2 weeks before care, and the solid line the trend 2 weeks after care. The finding that each trend is different in direction suggests that either the weekly trend has little meaning, or that a longer period is required to identify a trend, perhaps all weeks between spinal correction.
_of_one_week_(-2)_before_(dashed)_and_1_week_(_2)_after_.png)
I also hold that the trend of HRV within 1 day has little clinical meaning. On their own the trends for each of the 2 weeks shown allow a meaningless decision that HRV is increasing (thought good) in one week and decreasing (thought bad) in another. Another weakness of the trend is not knowing where it ends and levels out; it certainly can not continue to either increase or decrease and should reach a state of balance. However the nature of multiple readings is that the term ‘accuracy’ means reading values will always distribute about a true value (bias suggests how closely they may do this), and every collection of such readings will show a line of best fit, no matter how it is calculated.
For these reasons I discount trends and favor the mean over a period of time. In turn this raises the question of the number of measures needed from 1 day to allow a mean with clinical meaning. I would suggest all readings for one 24-hour period be used to generate the mean value for that period to allow comparisons with like data. My useful data reflect weekly collections of daily cHRV data in which case the question becomes ‘for how many weeks’?
The manner in which cHRV readings are collected in the Apple™ CW allow straightforward extraction of all readings for any one day, and the logic of my argument that all readings for one day should be analysed to determine the daily mean is that it captures the full range of the functional performance of the ANS from during sleep to during activities. On a similar basis, any comparisons are to be made using the means of each of 7 consecutive days to include days of changing activity across the usual range of activities undertaken by the subject. It may be that the means of 3 selected days could have value but I have not investigated this, using 7-day weeks for completeness at this exploratory time. The dotted lines in Figure 3 show the means for each of 2 weeks, gathered in the manner now described. They carry a clear clinical meaning but again I caution against any association with the instance of chiropractic correction that separates them.
DISCUSSION
This report cautions against the use at this time of CWs in chiropractic practice to take measures of cHRV. This is not necessarily a criticism of the data gathered in this manner; instead, it may be that the volume of data returned over the 7 weeks of this inquiry has revealed matters that must be addressed before clinical meaning can be assigned to cHRV. Many of the questions raised by this report are equally valid for data obtained by traditional methods.
Frankly, at this time we should not assign any value to HRV beyond accepting it as an indicator of the responsiveness of the ANS. All else beyond this point is conjecture, which I now address.
HRV in Chiropractic
The idea underpinning the use of HRV as a clinical measure in chiropractic is that the ANS directs the function of many more organs, glands and systems than the heart. In a global sense it is thought preferable to have an agile ANS which would be shown as a higher value of HRV than would be seen with a turgid ANS; however, recent reports in Systems Biology suggest the matter is very much more complicated. Increased variability is traditionally seen as being ‘associated with a good health condition, whereas lowered variability might signify pathological changes.’38 Ernst reported ‘newer integrating theories which suggest HRV reflects as much the state of the heart as the state of the brain.’ He describes the polyvagal theory as suggesting that the physiological state dictates the range of behaviour and psychological experience. Ernst states ‘reduced variability will according to this theory not only be a surrogate but represent a fundamental homeostasis mechanism in a pathological state.’38 He also discusses a ‘neurovisceral integration model’ that proposes ‘cardiac vagal tone, described in HRV beyond others as HF-index, can mirror the functional balance of the neural networks implicated in emotion-cognition interactions.’ It is clear that the discipline of chiropractic is yet to publish at a contemporary level of understanding regarding the clinical meaning of HRV.
Recent reports are conflicting with their findings. Galaasen Bakken et al39 found ‘no statistically significant differences … between groups for any of the Heart rate variability indices’ in a controlled group of 66 participants, while Steinberg et al40 reported ‘improved autonomic nervous system function measured through HRV and thermography, in 5 adult patients receiving chiropractic care’, and Santos-de-Araújo et al41 found ‘the HRV indices were significantly associated with pain intensity, disabilty, and catastrophizing in individuals with chronic neck pain’.
The conventional idea of chiropractic is that correction of subluxed vertebrae provides a stimulus into the nervous system. What happens then is open, but it seems there is an expectation that such sudden input from a corrective thrust will adjust the nervous system toward a normal homeostatic balance. The effect of such adjustment should be seen in organs blatantly under the control of the ANS, and the heart is the organ with the most prolific and readily accessible functional data. Ergo, changes in HRV should show effects of a spinal correction mediated by the vagal neural complex, a premise without replicable evidence beyond case reports at this time.
The Matter of ‘On Demand’
On first release, the Apple™ CW recorded HRV during use of the Breathe™ app. This functionality was reported in April 2018 in relation to watchOS 4,42 however with updates to the OS the ‘on-demand’ functionality by selecting ‘Breathe’ ceased, meaning that for a period of time my use of Breathe™ no longer captured a value for HRV. It was reported to have had returned43 by the time of revising this paper (March 2022) and indeed seems to have been functional from late October 2020. At the time of revision the ‘Breathe’ function had been incorporated into a ‘Mindfulness’ app (Watch Series 7 (GPS) running Watch OS 8.5.1 under iOS 15.4.1)
An ‘on demand’ functionality is essential for clinical use and without this ability a CW could not be used for measurement at the time of consultation. Should it become evident that it is possible to obtain a HRV reading on demand during a consultation then I propose that a chiropractor obtains and dedicates one CW and paired phone to be held in the clinic as a consistent instrument between consultations and patients. This is preferable due to privacy and ethical issues rather than by seeking access to the patient’s data on their own device. However the only way to obtain longitudinal data between clinic visits is from a patient’s device and access would need to be with the patient’s express permission. Pragmatically, this is no different to a patient reporting other vital signs such as a daily measure of weight by reading from written notes.
The Matter of Overall Variance
I consider the daily variance, or the measure of the spread between values, to be so great as to not allow meaning from any single measurement as given in this report. I appreciate I am reporting N-of-1 data and I do so only in an indicative manner and certainly not to be inferential. Indeed, my use of the 2-tailed p-test is questionable with such few data. However VAR has more value than instantaneous readings which are meaningless on their own. Trends connecting instantaneous readings, of cHRV values, need further investigation to understand their relevance
However, VAR suggests research questions that must be addressed: ‘what is the 24h circadian pattern in a cohort of subjects undergoing the same daily activities’; ‘do these patterns hold on the same day under the same conditions a week later?’; 'what could a high or a low variance mean in terms of the responsiveness of the ANS and its relationship to wellbeing?; and ‘in the female patient what is the temporal relationship to the menstrual cycle?’ At this time I caution against using VAR as an indicator of any effect associated with spinal correction but suggest that a desirable clinic outcome could be the ‘flattening’ of ANS activity as reflected in the VAR of the means I have given from week to week.
Here, the variance for the 3 weeks pre care is 6.25 and post care, 0.17. This does suggest some meaning and questions need to now be asked to seek meaning in this finding. In pragmatic terms a ‘flattening’ of variance suggests a more stable responsiveness of the ANS to external and internal stimuli. I recommend that others pursue this line of inquiry.
A Summary
I question whether cHRV values closely resemble the data obtained by conventional means and suggest that CWs have marginal use in the clinical environment.
It is also generally accepted that a higher HRV is preferable to a lower HRV; however, the repeatability of this measure is difficult to determine and I caution against thinking it has meaning when taken instantaneously, such as concurrently with consultation. I conclude that even with a relatively controlled domestic environment the VAR is unpredictable and too high to allow meaning. This extends to data collected over a day, a week and in my case, 2 3-week periods.
Conclusion
This report raises many questions that deserve to be addressed in a structured manner. The first is to address the within-day variance, perhaps looking for associations with other clinical measures, or behaviours, or even diet. Only then can a time-series study be undertaken to find a meaning in longitudinal data. At worst, it could be that normal fluctuations are such that they mask any effects that could be associated with chiropractic care.
While respecting the reports that are emerging6,7,40,41,44 I remain cautious with taking any meaning of cause and effect from them, let alone an inference that others may replicate such findings. It may be, as I hint and Haas and Russell7 infer, that a longitudinal measure is useful. They showed that 'HRV, measured by SSDN, increased over the early part of their course of chiropractic care, and these increases were sustained whilst the patient remained under long term continuous care in all 6 patients. Improvements in SDNN ranged from 50% to greater than 300% as compared to pre-care values.7 If HRV has the volatility I report then future studies must be designed accordingly.
On the other hand we must remain mindful of VAR, not just as a report of the spread of the data, but more what that spread means, especially when it changes. The paradigm within which these matters reside is that the function of the ANS reflects the tone of the nervous system.
The putative effect of correcting subluxation is the normalisation of this tone45 however McDowall found ‘no clear interpretation of tone in the contemporary chiropractic literature.’ He did note that ‘tone is closely aligned with functional neurology and can be understood as an interface between the metaphysical and the biomedical’ and concluded that ‘using the concept of tone as a foundation for practice could strengthen the identity of the chiropractic profession.’
My decision on my Experienceable Difference Test is that CWs do not offer sufficient reproducibility to warrant consideration at this time by a chiropractor as an instrument in clinical practice, and I caution against thinking such clinical evidence may have meaning. There are sufficient indications in this report and other chiropractic reports published to date to suggest that cHRV could have a value with assisting the clinical evaluation of an individual’s health status but certainly no evidence that it does.
I do not consider CWs a reliable clinical tool at present.
Caveat
The caveat with this report is that I have undergone 2 major surgeries since September 2017, most recently a double cardiac artery bypass graft in December 2019. Lakusic et al reported ‘Many studies have unequivocally demonstrated that coronary artery bypass grafting surgery generally leads to significant reduction in heart rate variability.’46 It is not known whether this reduction is phasic with the variance noted in this report or not.
The attendance of post-CABG patients to chiropractors is yet to be critically reported however it is fairly safe to assume they would be found in the case-mix of most conventional chiropractors. My own such practice included one such patient. I consider it essential for others to extend this inquiry, not only with cohorts of healthy adults but with randomly selected cohorts of patients from a number of clinical settings.
Declarations
The CW discussed in this paper is an Apple Watch Series 5 running watch OS 7 from mid September 2020 with 2 incremental updates to 7.0.2, paired with iPhone 11 Pro Max with iOS 14 from mid September with an early incremental update to 14.1. All devices are retail purchases by me with education discount and are owned by me. There is no relationship with any company in any form beyond normal consumer support.
I express my gratitude for the professional courtesy of the chiropractor providing my care for this report.
Funding was neither requested nor received for this study and report.