


INTRODUCTION
Timing of a health care intervention is sometimes not adequately considered:
While competent in specifying how to treat, medicine generally fails to decide correctly when (emphasis added) to intervene in the evolving process. This is the main source of medical iatrogenesis.1
It is important for clinicians to know if there are indicators pointing to an optimal time to intervene in the evolving process. For some conditions, such as medical emergencies, there obviously is no question as to when the intervention should occur. There are other, more subtle conditions though, where correct timing for the remedy may be unknown, or not considered.
In traditional type chiropractic the objective is to improve neurological health through spinal adjustment.2 The question of when to adjust (to improve neurological function) has long been a cornerstone consideration in chiropractic practice. Chiropractic pioneers Drs. B.J. Palmer and Lyle Sherman promoted the use of thermal pattern analysis as a method to help the chiropractor decide when to adjust.3 This method assesses the adaptability of the autonomic nervous system.4 The approach is important since autonomic adaptability plays a crucial role in the maintenance of good health.5 In the thermal pattern approach, adjustment is given only when there is strong evidence that a persistent pattern is present.3
In recent years chiropractors have become interested heart rate variability (HRV) as another option for assessing autonomic adaptability. This is a good step for chiropractors since HRV is considered a gold standard in the evaluation of autonomic health.5 In HRV, time-domain measurements, such as the root mean square of successive differences between heart beats (rMSSD) analyze the variation of time between heart beats. In a healthy autonomic nervous system, there should be some variability of time between beats, as a reflection of the constant moment-to-moment changes occurring in the body, even at rest. This variability is governed by the autonomic nervous system. At the end of an HRV recording, a numerical value is reported for rMSSD. Higher rMSSD values are healthier than lower values, with the probable exception of arrhythmias which tend to artificially inflate rMSSD values. In general, then, higher rMSSD values correspond to greater autonomic adaptability compared to lower values.6 The present study uses rMSSD and uses the terms HRV and rMSSD interchangeably.
Chiropractic research has traditionally used HRV as an outcome measure following spinal adjustment, where the need for spinal adjustment was based on non-HRV measures such as palpation and leg length inequality.7,8 I have taken HRV a step further in my practice, to include it not only as an outcome measure, but also as a method of determining when to adjust – on every visit.9 This approach considers published normative data for determining when to adjust. One source indicates that a normal rMSSD value for healthy adults is approximately 20 milliseconds (ms) while another source reports this normal to be approximately 30 ms (9-10). The average of these 2 normative values, 20 ms and 30 ms (= 25 ms) is the approximate level of HRV I use with my patients for determining when to adjust according to HRV. I continue to consider other methods such as thermal pattern analysis and leg-length inequality findings to also assist in the determination of when there is a neurological disturbance and therefore when to adjust.
Purpose of the Study
Some patients in this study were adjusted mainly according to HRV while other patients were adjusted mainly according to non-HRV methods. This potentially sets up 2 groups that can be compared to assess HRV outcomes. In particular, the purpose of the study is to determine if there might be an optimal level of HRV for giving patients a spinal adjustment in this chiropractic practice. The determination is based on comparing HRV findings before versus after spinal adjustment during a single office visit. A literature search indicates that this is the first study of its kind, where optimal timing for spinal adjustment is investigated using an evidence-based neurological assessment (of HRV).
METHODS
Thirty-eight adult patients (10 females and 28 males, ages 24-85) from my chiropractic practice who gave their written consent were included in this retrospective observational study. They typically sought relief of neuromusculo-skeletal type symptoms. The study design includes only 1 office visit, where pre-adjustment HRV is compared to post-adjustment HRV within a 15-minute period. For many patients this was their only visit at the time of this writing. Consequently, follow-up examination and consultation is currently not available to assess improvement (or lack thereof) regarding symptoms and HRV. The study only assesses HRV improvement (or lack thereof) in the context of the 15-minute office visit, pre-versus post adjustment.
At the time the study idea was conceived, there were approximately 30 consecutive patients who had received HRV examinations before and after their spinal adjustment. At that point I began calculating statistical significance and sample size for HRV change every few additional patients until statistical significance was achieved. At the point of 38 patients, statistical significance had been achieved with sample size estimates calling for only n = 4 in each group to detect statistical significance (at 80% power and 2-tailed significance). At this point data collection was stopped.
HRV was measured with smart phone app technology, Heart Rate Variability Logger.10 The app works with a Kyto sensor attached to the patient’s earlobe (Figure 1). Here it optically detects blood volume changes using the technology of photoplethysmography (PPG; Figure 1). The sensor then sends a Bluetooth signal to the app which calculates the HRV values. The set-up agrees well with standard ECG technology.11,12 HRV readings were recorded for 60 seconds for both pre-adjustment (“pre HRV”) and post-adjustment (“post HRV”). As previously mentioned, patients were adjusted by the author according to a) HRV and b) non-HRV findings (e.g., thermal pattern analysis and leg-length inequality assessment).

For most patients, the decision to perform a spinal adjustment was based primarily on HRV while in remaining patients the decision was based on a mix of HRV and non-HRV findings. Most adjustments were made for subluxation of the atlas (C1) vertebra (Figure 3). A subluxation is defined here as a slight misalignment to the extent that it disturbs autonomic function via spinal nerve and/or cord irritation.13 Figure 2 shows adjustment set-up for atlas subluxation, the most common vertebra adjusted in the study.
_using.jpeg)
Analysis
There were 3 main variables in the study: a) pre HRV, b) post HRV, and c) HRV change, calculated by subtracting pre HRV from post HRV. A positive HRV change is desirable, since larger HRV values are healthier than smaller ones, e.g., post HRV of 22.0 ms - pre HRV of 20.0 = 2.0 ms HRV change. This is the main variable of the study. Analysis included the following:
-
HRV change in low versus high HRV groups (groups defined in Results) using the 2-sample t test with the unequal variance option. The low and high HRV groups are the 2 groups of the study
-
Comparison of the number of patients whose HRV worsened in low versus high HRV groups using a test of proportions.
-
HRV change in male versus female since gender representation in the study was noticeably unbalanced (more males) using the 2-sample t test with unequal variance option. For this comparison, only the low HRV group was analyzed since the high HRV group had only 1 female. In this way possible effect from gender imbalance can be assessed.
-
Percent of atlas-only adjustment between groups. This was conducted to compare types of care between the low and high HRV groups. Atlas (C1) was selected since it was the mode (most common) spinal segment adjusted in the study. A test of proportions was used here as well.
The t tests and test of proportions were performed in Stata 12.1 (Stata Corp, College Station, TX). Two-tailed p-values less than the conventional level of statistical significance 0.05 were considered statistically significant. An effect size statistic, that used a pooled standard deviation was included for the main variable of the study, HRV change to assess the magnitude of the difference in HRV change between low versus high HRV groups.
RESULTS
Low vs. High HRV groups
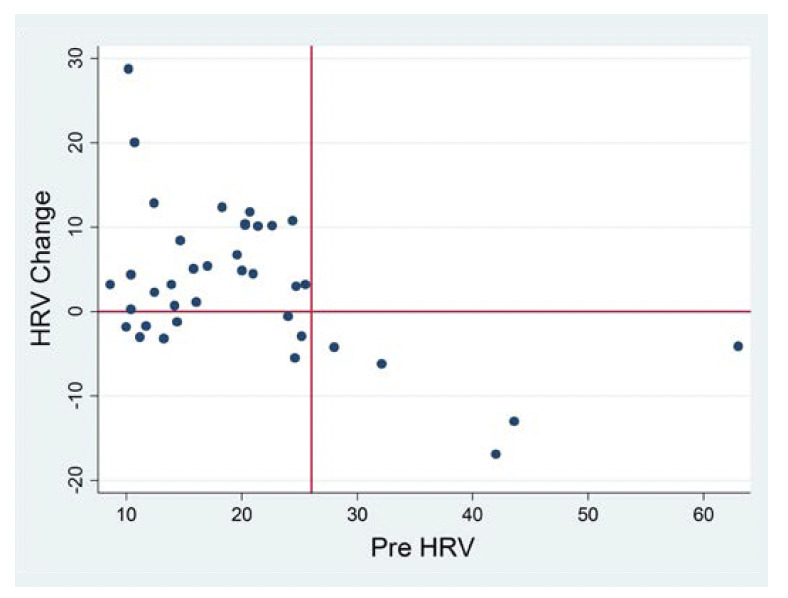
The 2 groups in the study, low HRV versus high HRV were distinguished by using the scatter plot in Figure 3 where they are separated by a vertical line. This line is positioned at a point a) where most HRV changes to the left of the vertical line are above the 0 (horizontal) line, indicating an increased (improved) HRV response following spinal adjustment (post HRV - pre HRV = a positive number); and b) where all HRV changes to the right of the vertical line are below the 0 line, indicating a decreased (worsened) HRV response following spinal adjustment (post - pre = a negative number). This line was positioned at the pre HRV value of 26.0 ms, separating the low HRV group on the left (n=33 patients) from the high HRV group on the right (n=5 patients). The range of pre HRV values was 8.6 ms to 25.5 ms for the low HRV group and 28.0 ms to 63.0 ms for the high HRV group. In other words, the first observed value to the left of the vertical line is 25.5 ms and the first to the right of the line is 28.0 ms.
Statistical Results
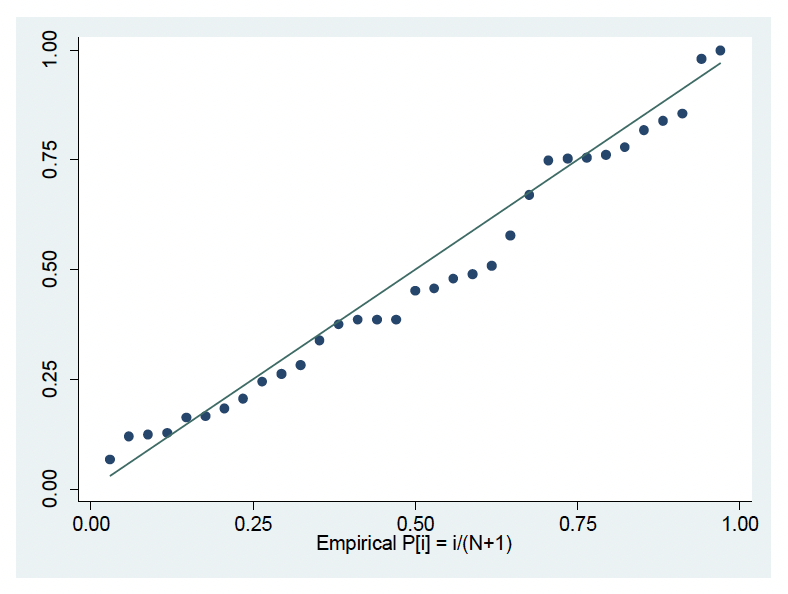
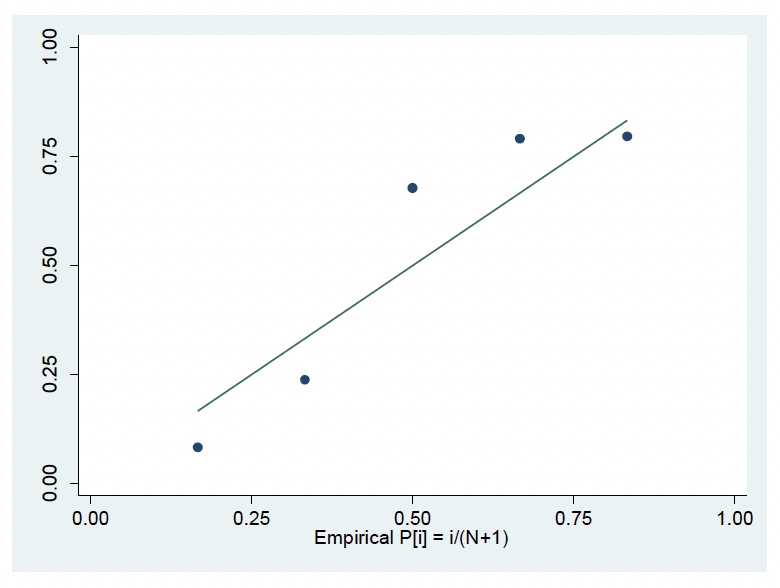
Where t tests were performed, normal probability plots showed acceptable normality, where the data points are reasonably close to the plotted line. The plots are provided for the main variable of interest, HRV change (Figures 4 and 5). The remaining plots are available upon request.


By gender
In the low HRV group, mean HRV change for females (n = 9) was 3.5 (SD = 6.5) compared to 6.0 (SD = 7.4) in males (n = 24), a difference that was not statistically significant (p = 0.4).
Low vs. high HRV groups
Mean age in the low HRV group was 51.9 years (SD = 14.1) compared to 47.8 (SD = 13.9) in the high HRV group. This age difference was not statistically significant (p = 0.6, Table 1).
In the low HRV group there were 24/33 (72.7%) patients who received atlas-only adjustment compared to 3/5 (60.0%) in the high HRV group. The difference between these 2 percentages also was not statistically significant (p = 0.6, Table 1).
Mean HRV change in the low pre HRV group was 5.3 ms (SD = 7.2; ranging from -5.5 ms to 28.8 ms). In the high HRV group mean HRV change was -8.9 ms (SD = 5.8, ranging from -16.9 ms to -4.1 ms). The difference in HRV change between these groups (low HRV versus high HRV) was statistically significant (p = 0.0026, Table 1) with a large effect size (of 2.0).
In the low HRV group for HRV change, 8 out of 33 patients (24.2%) worsened following their spinal adjustment compared to 5 out of 5 (100%) in the high HRV group. The difference between these percentages (24.2 versus 100) was statistically significant (p = 0.0009, Table 1).
Since there were some patients who worsened in the low HRV group, a test of percentages was calculated, comparing the 8 out of 33 in this group who worsened (24.2%) to the remaining 25 out of the 33 (75.8%) who improved. The difference between these 2 percentages (24.2 versus 75.8) was statistically significant (p = 0.0000).
DISCUSSION
Patients in this study whose pre-adjustment HRV was 25.5 ms or lower tended to experience better HRV changes following their adjustment compared to those who had a pre-adjustment HRV of 28.0 ms or higher. When an adjustment is indicated, evidenced by the lower HRV, the body may be more “accepting” of the spinal adjustment, compared to when adjustment is not indicated as was observed in the high HRV group.
Age and type of care were essentially the same between low versus high HRV groups. Obviously, there are other factors that could account for differences of HRV change between groups, but the differences were probably not due to these 2 major factors (of age and type of care).
In the low HRV group, where adjustment was indicated, there were also some patients who experienced a worsening in their HRV change. This should be considered in the context that there is no guarantee for a net benefit following any health care procedure, whether medical or chiropractic. Indeed, medical iatrogenesis was recently reported in a Johns Hopkins University study as the third-leading cause of death in the United States.14 From the patient’s standpoint it is a matter of probability, of whether there will be a net benefit following a healthcare intervention, whether the intervention is applied by a medical doctor or a chiropractic doctor. Since there was a statistically significant number of patients in this group (low HRV) who experienced an improved HRV change, the probability is that patients who need an adjustment (e.g., where their pre HRV is 25.5 ms or lower) can reasonably expect a net autonomic benefit following their adjustment.
There was a small gap of 2.5 ms between the highest HRV value in the low HRV group (25.5 ms) and the lowest HRV value in the high HRV group (28.0 ms). In other words, no patient in the study had a pre HRV value between 25.5 ms and 28.0 ms. Thus, it is unknown which HRV group such future patients in my practice would be in, and therefore unknown if spinal adjustment would be indicated for them according to HRV. Since I’m conservative in my decision to intervene, I would probably consider these patients (who have a pre-adjustment HRV value between 25.5 and 28.0) to not need an adjustment. Analysis of future patients who have these pre HRV values will likely shed light on this present unknown.
No adverse symptoms were reported by patients whose HRV worsened in this study. However, their autonomic health suffered somewhat following their adjustment, at least temporarily. It could be argued that there is no problem with these patients because they did not experience adverse symptoms. However, as the well-known Harvard-trained biologist Rene` Dubos states, people tend to be “impressed with diseases that have obvious manifestations, yet some of their worst enemies tend to creep on them unobtrusively”.15 The body does have an amazing ability to maintain and heal itself and could be expected to do so soon after the subtle iatrogenesis of worsened HRV. However, this self-healing does not excuse the clinician from making evidence-based, correct decisions about when and when not to intervene in the evolving process. After all, the first rule in health care is primum non nocere (first do no harm). Other tests I use to assess neurological function may have shown improvement following spinal adjustment when HRV indicated a worsening. In my opinion however, HRV is a stronger measure than the other measures because it (HRV) has more research supporting it.
Limitations of the Study
The study setting is a single office visit for these patients. Consequently, it is not known how long the autonomic set-back lasted in patients whose HRV worsened following their adjustment. Future study should include at least 1 follow-up visit to study this unknown.
There may be a question as to whether an HRV change as small as 5.3 ms (mean HRV change in the low HRV group) is clinically significant. In comparison to another evidence-based assessment, a study on hypertension showed that a 3 ms difference separated persons with hypertension versus without hypertension.16
The study had a noticeably larger number of males compared to females. This may be partially due the weekly house calls I make to a male-only halfway house for those recovering from substance abuse. Thirteen of the patients in the study lived here, 11 of which had low pre HRV while the remaining 5 had high pre HRV. The difference of HRV change between genders in the low HRV group was not statistically significant. Consequently, gender sample size imbalance does not appear to be a factor in the study.
There was also an obvious imbalance of patients in low versus high HRV groups (33 versus 5). Since there were no serious violations of t-test assumptions then the statistical testing in the study should be considered valid. In two sample t-tests it is not necessary for sample sizes to be the same, or even similar. Furthermore, very small sample sizes can be used in t tests.17
The study is limited by its observational design, thereby inhibiting generalization to other chiropractic practices. However, there does not seem to be an impediment to some level of generalizing when other literature indicates a normative value around 25.0 ms (9-10). which of course is a value similar to the value of 25.5 ms cut-off observed in the present study.
Since there are no other studies on this topic that I am aware of, there are no comparison to other similar studies that can be made at present.
A final limitation is that I was was un-blinded when doing the analysis. Given that some of the results were not exactly ideal, where some of my patients’ HRV findings worsened, this un-blinded approach does not appear to have been a bias in the analysis.
Comparison is a hallmark concept in epidemiology. A strength of the study is that 2 groups of patients were compared, based on different pre-adjustment HRV findings. This further allowed for a comparison of post-adjustment HRV outcomes, based on the different pre-adjustment HRV findings.
CONCLUSION
In this study, patients with a pre-adjustment heart rate variability (rMSSD) value of 25.5 ms or lower tended to show a better (larger) HRV value following their adjustment compared to patients with a pre HRV value of 28.0 ms or higher. Further research with other chiropractic practices is needed to validate these findings.