


INTRODUCTION
Online assessment is an important part of academia for virtual primary education, online degree programs and clinical degrees. This emergence of a more fully online educational era was accelerated by the Covid-19 Pandemic. Assessments require parameters that maintain high integrity and reliability while not having an overburden of unrealistic question pool size. This need for question pool efficiency is the impetus for this endeavor.
We introduce the benefits and challenges of computer-based testing (CBT) and expand them into the online environment. We look at the challenges of cheating and related strategies of mitigation and detection. We focus on the challenge of balancing assessment parameters such as class size, question bank size, assessment size and maximum number of overlapping questions. Further definition of these parameters are described in Table 2. The benefits of computer-based testing (CBT) include question duplication, question randomization, answer randomization, ease of administration, immediate feedback of results1 and similarity to emerging standardized licensure tests. Grade performance comparisons between CBT and paper have been mixed.2 The challenges of CBT include initial set up and cheating.1
Academic cheating is defined as “unethical or unauthorized academic activity.”3 The negative effects of cheating include unfairness to honest students,3–7 questionable assessment validity,3 reinforce cheating in the future,4 allowing inadequately prepared students to pass, inadequate preparation for standardized exams required for licensure and affecting assessment grade curves. The prevalence of cheating has significant variation [between 5 to 94% ] and varies geographically7 and by context.4,5 From 1963 to 1993, self-reported cheating increased and may be related to changing social climate.5 Cheating seems to effect individual performance; however, does not seem to result in statistically significant population differences.2 Lower GPA students have a greater correlation with cheating activity (r=-.23).5 Superficial study methods correlate with more cheating activity.7 See Table 1 for a list of cheating methods with strategies for solution.
We focus on the set up of assessment parameters to avoid online coordinated cheating (aka “peer-to-peer sharing”) by limiting question overlap.
Methods
Formal Problem Statement
We can now phrase the central question this section seeks to answer as follows: Given a class of s students, where each student is given an assessment of n questions drawn randomly (without replacement) from the same question bank of N questions: "What is the probability that no pair of students has more than q questions in common?"
Notation and Definitions
Integrity: We will define the integrity of an assessment, denoted as I, as the percentage of questions any pair of students are guaranteed not to have in common. So if we want to insure that no pair of students has more than q questions in common, then the minimum percentage of questions they do not have in common, or the integrity of that assessment, would be:
I=(1−q+1n)∗100%.
This definition of integrity gives us an upper limit on the degree to which any pair of students can cheat solely by sharing their answers. So if an assessment has an integrity of 70%, this means that the students have at most 30% of their questions in common, telling us the extent to which they can cheat. Given the integrity, the most questions any pair of students can have in common is:
q=Floor[n∗(1−I100%)].
where the “floor function” rounds q down to the next lowest integer.
Reliability: When randomly drawing questions from a common pool, nothing is guaranteed. It is possible, even in a large class, for every student to get exactly the same n questions. However, if the size of the question bank is large enough, we know that this is very unlikely to occur. What we would like to do is quantify the probability that a randomly generated assessment for a class will have a certain integrity.
We will call the likelihood that an assessment for an entire class has an integrity of I, as the level of reliability of the assessment, and shall denote it by R. Therefore an assessment which had an integrity of 80% with a reliability level of 90%, means that for 90% of the assessments we generated for a class, every pair of students would have 20% (100%-Integrity) or less of their questions in common.
Reliability, in a sense, tells us for what percentage of assessments our method “works” (i.e. has a certain integrity). This concept is a common in practically any type of statistical methodology and is analogous to the “confidence level” used for a confidence interval.
Theory
Since we are interested the number of questions on an assessment that pairs of students have in common, we start by labelling the students 1,2,3,…,s and let Xi,j denote the number of questions students i and j have in common. The reliability of an assessment with integrity I, or the probability that every pair of students will have q questions in common or less (where q is determined using i.b) is:
R=Prob(X1,2≤q and X1,3≤q and …. Xs−1,s≤q).
However, the number of questions in common between any pair of students is independent of any other pair of students (since the questions are drawn randomly for each student). Therefore, since the probability of the conjunction of independent events is the product of the probability of the events, it follows that:
R=Prob(X1,2≤q )∗Prob(X1,3≤q)∗….∗Prob(Xs−1,s≤q).
The probability that any two students will have q questions or less in common is independent of the pair of students chosen, so each of the probabilities on the right side of (ii.b) are equal. Hence we can drop the student label subscripts and simply let X denote the number of questions any two randomly chosen students have in common. Letting F(q)= Prob(X≤q) the expression for R reduces to:
R=F(q)∗F(q)∗….∗F(q)︸number of pairs of students
Since there are s(s-1)/2 pairs of students, it follows that:
R=F(q)s(s−1)2
F(q), the probability that 2 randomly chosen students have less than q questions in common, comes from probability theory. To explain the derivation of F(q), we consider a scenario where n questions are randomly drawn from the question bank: first for one student (student 1) and then for the other student (student 2). After the n questions are randomly drawn for student 1, we can partition the N questions from the question bank into 2 sets: the n questions that were drawn for student 1 and the N-n questions from the bank that were not. Now when the questions for student 2 are drawn we can similarly partition them as shown below.
The probability that student 2 will draw x questions from the n questions drawn for student 1 and draw n-x questions from the N-n questions student 1 did not draw is given by the hypergeometric distribution12:
Prob(X=x)=(nx)(N−nn−x).(Nx).
where gives the number of combinations or ways k objects can be chosen (without replacement) from a set of m objects.

Of course to obtain our desired quantity, F(q), we just sum up all of these probabilities from x=0 to x=q, to get:
F(q)=Prob(X≤q)=x=q∑x=0[(nx)(N−nn−x).(Nx).]
The function F(q) is commonly known in probability theory as the “cumulative distribution function” (or CDF), and it can easily be computed by most commonly used software (like Excel).
Some Sample Calculations
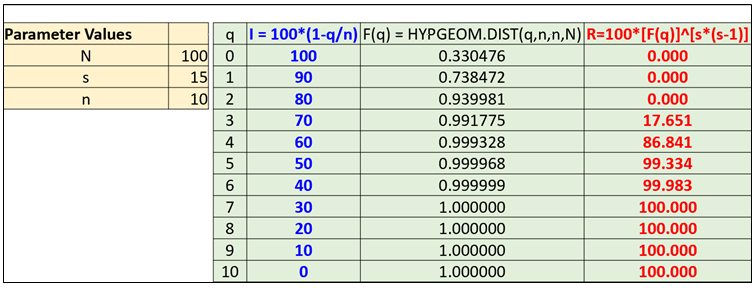
We note that the integrity is a function of only q (the maximum number of questions any two random pair of students can have in common) and n (assessment size). The reliability, on the other hand, is a function of q,n, s (class size), and N (question bank size).
To illustrate how I and R are computed, we present some calculations for a sample problem involving an assessment of 10 questions (n=10) each drawn randomly from a question bank of 100 questions (N=100) for a class of 15 students (s=15). In Table 3, we show how the integrity and reliability are computed (in Excel) for each value of q (i.e. maximum number of questions any pair of students can have in common).
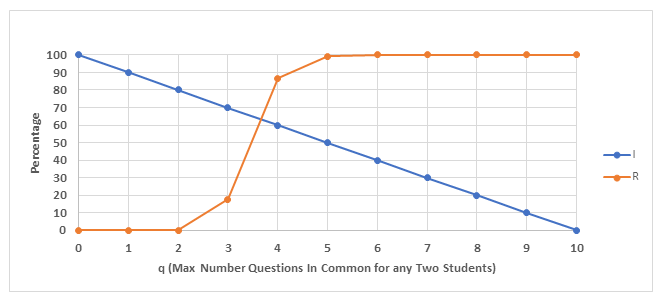
Figure 1 shows the plots of the integrity (I) and the reliability (R) in Table 3 as a function of q. We see that at q=0, I starts at 100% and decreases linearly to 0% at q=n., as predicted from equation (i). R on the other hand, begins at 0% and decreases continually as q increases, until it reaches 100% at q=n. Mathematically, we expect R to be an increasing function of q, since R is a CDF, and the CDF is an increasing function of q (since the probability that the number of questions 2 students share is less than or equal to q increases as q increases).
.png)
Figure 1 illustrates our first major finding: for a given class size (s), if both the question bank size (N) and assessment size (n) are fixed, we cannot construct an assessment with any arbitrary reliability and integrity. Figure 1 illustrates this fact: if we want a very high value for I (which occurs for 0≤q≤3), we cannot get an R >20%, and if we want to have a large R (which occurs for 5≤q≤10), I will not be more than 50%. Thus, it would not be possible to construct a test that had both I and R of at least 90% for this given size of class, assessment, and question bank. This result is a general one and not dependent on the specific values chosen for s, n, and N used in Figure 1. It is never possible to optimize both quantities simultaneously, since maximizing I minimizes R and vice versa.
One solution to this problem is to notice that as q increases, I decreases (from 100% to 0%) and R increases (from 0% to 100%) , guaranteeing that the graphs of I and R cross exactly once. This point at which the graphs of I and R cross can then be used to “compromise” as to the best performance we can expect to achieve jointly with I and R. Since the curves rarely cross at an integer value of q, we can choose the value of q which minimizes the difference in I and R. Using this method in our example, we see from Figure 1, that the curves for I and R cross between q=3 and q=4. Since |R-I| is smallest at q=4, this is the best compromise for making both I and R large. Therefore when we have a class of s=15 students and we generate assessments of size n=10, drawn from a question bank of size N=100, the best we can hope to achieve is a reliability of 90% and an integrity of 60%. Thus, we can conclude that for 90% of the class assessments, no pair of students will have more than 40% of the questions in common.
Understanding the Factors Affecting Reliability and Integrity
In the last section, we showed that for a given class size (s), assessment size (n), and question bank size (N), we cannot generate assessments that have any chosen values for I and R. We also presented a method to find the optimal value of I and R we can achieve for a given s, n, and N.
Before getting into this method much further, it is good to stop and try to understand how the effect of the parameters in our problem, s, n, and N will act to affect I and R jointly. For each parameter, we will consider its affect alone (as the other two are held fixed)
Effect of Class Size (s)
We know that I is not affected by s, but R is. As equation (vi) shows, R is a probability that is raised to the power of the number of pairs of student. Hence, as the number of students increases, the number of pairs of students increase, and since raising a positive number less than 1 to a larger power causes it to become smaller, it follows that as s increases, R decreases. Figure 2 shows a plot of I and R vs q for 3 different class sizes, all having n=50 and N=500. We see that as s increases, the graph of I remains the same, but the graph of R shifts to the right, and the point at which the graph of I and R cross results in lower joint values of I and R.

Effect of Size of the Assessment (n)
Figure 3 shows a plot of I and R for different values of n (keeping s fixed at 10 and N fixed at 500) created using MatLab. To display the plots for the different values of n on the same graph, q is plotted as the percentage of n. For all 3 values of n, I is the same. However, as n increases, the graph of R shifts to the right. As a consequence, the point where the graphs of I and R intersects also moves to the right, resulting in lower values of I and R. Hence, we conclude, as n increases, our best choices for I and R will both tend to decrease.

Effect of N
Intuitively, we would expect that N will not affect I but as N increases, R should increase. This is not so obvious from the mathematical formula for R (equation vi), but can be proven. Figure 4 shows how the curve for R moves to the left as N increases, causing the point of intersection between I and R to generally yield higher values of both I and R.
To find these joint values of I and R requires a code be written that for a given set of values for n, N, and s, starts at q=0 and computes both I and R, as q is incremented by 1. The value of Q at which R>I indicates that the graphs of I and R have crossed. I and R for the values of q before and after the crossing occur are computed and the value of q for which |I-R| is smaller, is chosen.

Results
In this section, we show what type of performance we can expect from an assessment (in terms of I and R) if the assessment, question bank, and class sizes are all known. The method we will use is that described in section d. Using a program written in MatLab, I and R will be computed for each value of q from 1 to n-1. The program detects when the curves cross and then choosing the point on the side of the crossing where |R-I| is smallest.
In Table 4, we show the best joint values of R and I computed in this manner for some typical values of s, n, and N. The size of the question bank is varied from N=100 (perhaps the size of question bank an individual instructor might create) up to about N=12,000 (which is in the neighborhood of question banks used that accreditation exams in certain fields). The class size is varied from 15 to 60 (in increments of 15), and the number of questions on the assessment ranges from n=10 to n=70 (in increments of 20)
_and_r_(blue)_for_some_typical_scenarios.png)
Based on our earlier results, we would expect that for a fixed question bank size, I and R will improve as n or s decreases. Although this is generally true, it is not a mathematical fact, and as Table 4 shows, we see cases that violate this trend (such as R for N=500 and n=30). This is a consequence of the numerical method used to find the optimal choice of I and R and also due to the fact that R increases very rapidly in the region where the graphs of I and R cross.
We see that for small question banks (such as N=100), both the reliability and integrity degrade rapidly as n increases. A reasonable rule of thumb we have found from a number of calculations is that to insure both good integrity and reliability, n should be below 30% of N. Or conversely, if you know what size assessment you want, your question bank should be at least 3 times the number of questions on the assessment.
As N becomes larger, we generally see improvement in both I and R and the trend in both I and R (as either n or s decreases) becomes more stable. Generally, we have found that once the question bank exceeds 1,000, it is possible to attain integrity and reliability levels above 80% for class sizes below 60 and assessments having less than 75 questions.
What values of I would be considered reasonable? The integrity tells to what degree it is possible a student can cheat: an integrity of 60% means, for example, that it is possible for a pair of students to have 40% of their questions in common. Considering that 40% of an assessment is typically 4 letter grades and probably the difference between failing and passing, it would seem reasonable to require at least that I > 60%. It is also important to bear in mind that the integrity gives the worst case scenario since q is defined as the maximum number of questions two students can have in common. So even when I=60%, it is not likely that a given pair of students will have 40% of their problems in common. Moreover, even in a situation where the two students do have 100%-I question in common, it is highly unlikely all of the problems the cheating student has will be in the questions that overlap on their test and that of their accomplice’s.
Rather than focus on the specific values of I, it would be better to classify I in terms of what ranges it follows into. A tentative classification for I where we can define 3 levels as shown below (Table 5a and b):
If we apply these ratings to the results for the hypothetical test scenarios in Table 4, they appear as shown below in Table 6. We see that for small question banks (N=100 and 250), it is not uncommon for both R and I to have “poor” (P) performance. In fact, it is not until the question bank reaches on the order of 1000 questions, that we generally have at least moderately “moderate” (M) or “high” (H) performance for both I and R.
We also observe that it appears easer to attain better values of I than R: this is partly due to our classification system (poor for R is below 80% while poor performance for I is below 60%). It may, however, also be a consequence of how the optimal values for R and I were chosen. In future work, we will analyze R and I in greater depth to find other methods for computing their joint optimal values that have more stable behavior.
_(using_tables__5a_(17702.png)
Discussion
Using Table 6, we can describe a possible scenario and show how the table can be used. Pretend we have a class of 60 students (s=60), 10 questions in our test (n=10) and a question pool of 100 (N=100). The integrity (I) is moderate; however, the reliability (R) is poor. We could increase our pool to N=500 to obtain decent I and Rs if the number of questions in our assessment is: n= 10, 50 or 70. We would be moderately relying that the parameters we choose would consistently (reliability) create an assessment that would have low amount of overlap (moderate integrity). As a side note, other parameters that we have not discussed such as the Kuder-Richardson 20 (KR-20) would be affected adversely by n=10 if the questions are not discriminating between the upper and lower 27%. KR20 is a different measurement of whole “Test Reliability” for discrimination based on bi-serials. Using Table 6, we can consider other issues and how to address them. We can expand that table as the dynamics change.
Limitations
This study has been performed by theory and simulation. Other factors may alter the results such as: lack of contact between groups of student (clicks), lack of time to coordinate answers, different order of questions between students, some students know the material better than others, speed of students taking exam and time limitations set by professor. This study assumes a “worst case” scenario. This scenario assumes that all students have access to each other (“hypersocial”) and all students cheat (“hyper-dishonest”). Since these assumptions are incorrect, integrity values where depressed and thus moderate values were considered acceptable to adjust for this limitation.
Further Research
Defining group sizes for “normosocial” clicks will be the direction of future research in order to determine a more “effective s”. Also, we will explore different ways to create question pools such as drawing from multiple question pools by lesson or degree of difficulty.
Conclusion
Educators can use the Tables in this article to determine a reasonable question pool size and amount of questions on an assessment to obtain the integrity and reproducibility they desire. Instructors have a beginning list of factors that influence resistance to cheating using test parameters.
Consent
IRB Assurance #N2020-5-21-M with exemption since it does not constitute human subjects research.
Competing Interests
The authors declare no competing interests.